1.0. INTRODUCTION
Dementia has received greater public health attention in the last few decades, with increasing global demographic ageing.1 While efforts to find effective and accessible disease-modifying therapies are advancing, the emphasis remains on prevention, timely diagnosis, and intervention to improve quality of life and mitigate the costs and burden associated with dementia .2,3 In 2024, the Lancet Commission Report on Dementia outlined 14 modifiable life-course risk factors for dementia (low education, hypertension, obesity, alcohol, traumatic brain injury, hearing loss, smoking, depression, sedentariness, social isolation, diabetes, air pollution, high low-density lipoprotein cholesterol, and vision loss), with another 4 risk factors (poverty, wealth shocks, income inequality and Human Immunodeficiency Virus infection) recently proposed to integrate global equity considerations.4,5 These risk factors are targets of global dementia prevention programmes.6–8
Delirium- an acute neurocognitive impairment induced by illness drugs or toxins- is a strongly associated but often ignored potentially modifiable risk factor for cognitive decline and dementia.9–11 Its prevalence among hospitalized older adults is estimated to be between 20-52% in sub-Saharan Africa12–15 and 19-29% globally.16 In our earlier work, we suggested healthcare access disparities (delayed health-seeking practices among medically ill older Africans and poor access to intensive care) as reasons for the higher prevalence of delirium in African health care settings.12,17 These factors result in patients with higher illness burden and severity, which are associated with delirium, being found on general medical floors.18
There is a growing body of literature that supports the role of delirium in cognitive decline and new onset dementia. A recent meta-analysis of 23 studies attributed 1.8-fold greater odds of cognitive decline after discharge to delirium during hospitalisation among older adults.19 Leighton et al. retrospectively studied 12,949 Scots aged 65 years or older for up to 5 years after an incident episode of delirium and estimated the cumulative incidence of a dementia diagnosis at 9% by 6 months and 31% by 5 years.20 However, the external validity of existing studies of dementia after hospital-associated delirium is limited in that most are retrospective cohort studies and/or only observed surgical patients. Both delirium and dementia are reportedly undiagnosed in upwards of 60-80% of affected individuals.21–24 Given these high global diagnostic gaps, retrospective estimates of the risk of new-onset dementia after delirium may not be accurate. In addition, surgical patients may not represent all elderly patients admitted to the hospital as prior studies have found an association between surgery type, anaesthetic use, and subsequent dementia risk.25,26 Thus, there is a clear need to prospectively study the association between delirium and dementia in non-surgical patients to obtain accurate estimates of the risk of new-onset dementia after delirium. Finally, there is a dearth of literature investigating new-onset dementia risk after delirium in hospitalised older adults in Africa, where the burden of delirium and the projected increase in burden of dementia appear to be elevated.12–15,27 A truly global understanding of the effect of delirium on cognition requires studying populations in Africa, where racial and geographic variation in risk factors for delirium (e.g. access and quality of care, and care-seeking behaviour) and dementia (e.g. differential effects of APOE) may critically influence cognitive trajectories.
To begin to address this knowledge gap, we conducted a pilot study to estimate the incidence of new-onset cognitive impairment (NCI) 6 months after hospitalisation with delirium among previously cognitively unimpaired older Ghanaians. We aimed to refine the inclusion criteria, logistics, feasibility, and recruitment/retention strategies to facilitate a future, prospective cohort study examining predictors of dementia among Ghanaian adults hospitalized with delirium.
2.0. METHODS
2.1. Study Design
This was a prospective observational study. Older adults (aged 60 years or older) admitted for Internal Medicine via the emergency unit, with delirium, and no evidence of preexisting cognitive impairment were consecutively recruited within 24-72 hours of admission and followed up through their hospital stay till 6 months after discharge. At enrolment demographic data and data on socioeconomic status, frailty, substance use and medical history were obtained from, caregivers and/or gleaned from medical records. During hospitalisation, participants underwent delirium reassessment twice weekly until discharge to monitor changes in delirium status and severity. Cognitive (including delirium) assessment was subsequently performed at three (3) follow-up visits at home or a preferred location at 6 weeks, 3 months, and 6 months. Depression, perceived social support, and substance use were assessed at the 6-week visit.
2.2. Study Population and Recruitment
The study population was older adults hospitalised for medical (non-surgical, non-ICU) treatment at Komfo Anokye Teaching Hospital (KATH).The inclusion criteria were age ≥ 60 years; admission via the Accident & Emergency at Komfo Anokye Teaching Hospital for internal medicine; and the prevalent (presumably present at time of admission) delirium assessed at eligibility screening within 24-72 hours of admission. Participants with stroke, clinically significant intracranial lesions, known (clinically diagnosed) or probable dementia (Short Form of the Informant Questionnaire for Cognitive Decline in the Elderly, short IQCODE score >3.31),28,29 terminal diagnoses such as end-stage organ failure or advance malignancy, inability to speak English or Twi, interfering medical/mental illness or intervention (e.g. extreme breathlessness, intubation), or inability to attend follow up visits after discharge were excluded. The value of informant-based reporting in cognitive assessment, using tests like short-IQCODE, is increasingly recognized, particularly in diverse resource-limited settings like Ghana, where they can circumvent the diagnostic challenges posed by high literacy variability30
Each weekday morning, a study clinician screened the admission register for patients who met the age and admission criteria. Potential participants then underwent delirium assessment as outlined below. Exclusion criteria were evaluated against patient records and by interviewing the patient’s relative or caregiver with a criteria checklist and administering the short IQCODE to exclude participants with probable pre-existing dementia. Informed consent was obtained by proxy from the participants’ caregiver or relative, and from participants themselves at subsequent assessments, when possible.
2.3. Assessments
2.3.1. Delirium
We employed a 2-step process to enable the research assistant identify patients who were likely to have prevalent delirium. We used a research assistant-administered modification of the Brief Confusion Assessment Method (b-CAM sensitivity: 78%; specificity: 97%)31 to rule out patients who were unlikely to have delirium and then determined delirium status by study clinician diagnosis using the Confusion Assessment Method (CAM sensitivity: 90 -100%; specificity: 90 – 95%).32 If CAM-positive, the clinician also rated delirium severity with CAM-Severity Scale (CAM-S: 0-19)33 and enrolled the patient into the study. All three tools are based on the CAM algorithm, which defines delirium as the presence of three out of four criteria: criterion 1 (acute onset/fluctuating course of altered mental status) and criterion 2 (inattention) in addition to either criterion 3 (disorganised thinking) or criterion 4 (altered level of consciousness).31–33 Given that b-CAM is not validated in this population, we only used it to broadly target potential participants, making 2 significant modifications. Firstly, the original ‘months of the year backwards’ (MOTYB) attention task on bCAM was replaced with ‘days of the week backwards’ (DOTWB) to limit false positives. During pre-testing on non-delirious patients, 6 out of 8 older adults with over 6 years of education and no cognitive impairment were unable to perform the MOTYB task, whereas all 8 completed the DOTWB task. DOTWB (sensitivity: 84%; specificity: 82%) has demonstrated a better overall performance than MOTYB (sensitivity: 80%; specificity:61%) as a test of inattention in delirium assessment among older adults in an Emergency Department in the USA, and has been successfully incorporated into cognitive screening tools in middle-income settings, namely South Africa and India,34–36 which are relatively more comparable to Ghana. Secondly, we prioritized sensitivity by relaxing the modified b-CAM criteria such that a positive result for either criterion 1 (altered or fluctuating mental state, determined from their medical record or informant report) or criterion 2 (inattention, ≥ 2 errors on the ‘days of the week backwards’ [DOTWB] task) triggered a CAM assessment and CAM-S rating by a clinician to confirm or rule out delirium. This assessment was based on clinician observation while interacting with the patient and relative/caregiver and administering (or attempting to administer) the Identification and Intervention for Dementia in Elderly Africans Cognitive Screening Tool (IDEA), a brief cognitive screening instrument discussed in 2.3.2 below.37
Participants were followed up with twice weekly repeat CAM & CAM-S assessments until discharge and at each of the 3 follow-up visits (6 weeks, 3 months and 6 months post-discharge). Delirium resolution was defined as the presence of 0 or 1 CAM criteria for 2 consecutive assessments before discharge/hospital death. Delirium improvement was defined as a ≥1-point difference between in CAM-S score at enrolment and last recorded score before discharge/ hospital death.
2.3.2. Outcomes
The primary outcome of this study was NCI, defined as an IDEA score of <8/15 (‘probable dementia’) if CAM- negative at 6 months. IDEA is a 6-item cognitive test that was developed in Tanzania to screen for dementia in low-literacy populations with culturally appropriate questions.37,38 It has been validated (sensitivity: 85 -100%; specificity: 81 -92% Area Under the Receiver Operating Characteristic Curve >0.91) in community and clinical settings in Tanzania, Nigeria (a neighbouring West-African country), and Malaysia, and is being used as a key measure of global cognitive function in an Alzheimer’s Disease genetic sequencing study across 13 African sites, including Ghana.37–40
The secondary outcome was study attrition due to mortality and withdrawal/loss to follow-up. Where possible, we collected reasons for withdrawal from the study.
2.3.3. Other Assessments and Data
At enrolment, demographic data, educational status, socioeconomic status (International Wealth Index, IWI), occupation, frailty (Rockwood Clinical Frailty Scale, CFS), marital status, diagnoses, and dates and times of admission and discharge/mortality were obtained using a standardised questionnaire.41,42 Medical records were examined after discharge, to obtain medical diagnoses, and to assess the use of potentially inappropriate medications (PIM) for dementia or delirium (e.g., anticholinergics) according to the 2023 American Geriatrics Society updated Beers Criteria.43 At the 6-week visit, data on alcohol and substance use (World Health Organisation Alcohol, Smoking and Substance Involvement Screening Test [WHO ASSIST V3.0]), depression (Geriatric Depression Scale- Short Form [GDS-15]) and perceived social support (Multidimensional Scale of Perceived Social Support, MSPSS) were obtained from the participant and/or caregiver.44–46
2.4. Data Management and Statistical Analysis
We collected data using Research Electronic Data Capture (REDCap) on handheld tablets, cleaned it in Microsoft Excel and STATA v14.1, and analysed it in IBM SPSS Statistics 26.0. We reported categorical variables as frequencies and percentages, and calculated medians and interquartile ranges (IQR) for continuous variables. We calculated the cumulative incidence function for NCI, defined as IDEA<8 and CAM-negative for delirium at the 6-month, with mortality as a competing risk and right-censoring due to drop-out. We evaluated bivariate associations between independent variables and NCI using Fisher’s exact test (categorical) and Firth’s penalised logistic regression (continuous). We then fitted Cox regression models and estimated unadjusted hazard ratios of mortality with 95% confidence intervals (95%CI) to identify the drivers of mortality in this sample.
3.0. RESULTS
3.1. Study Sample
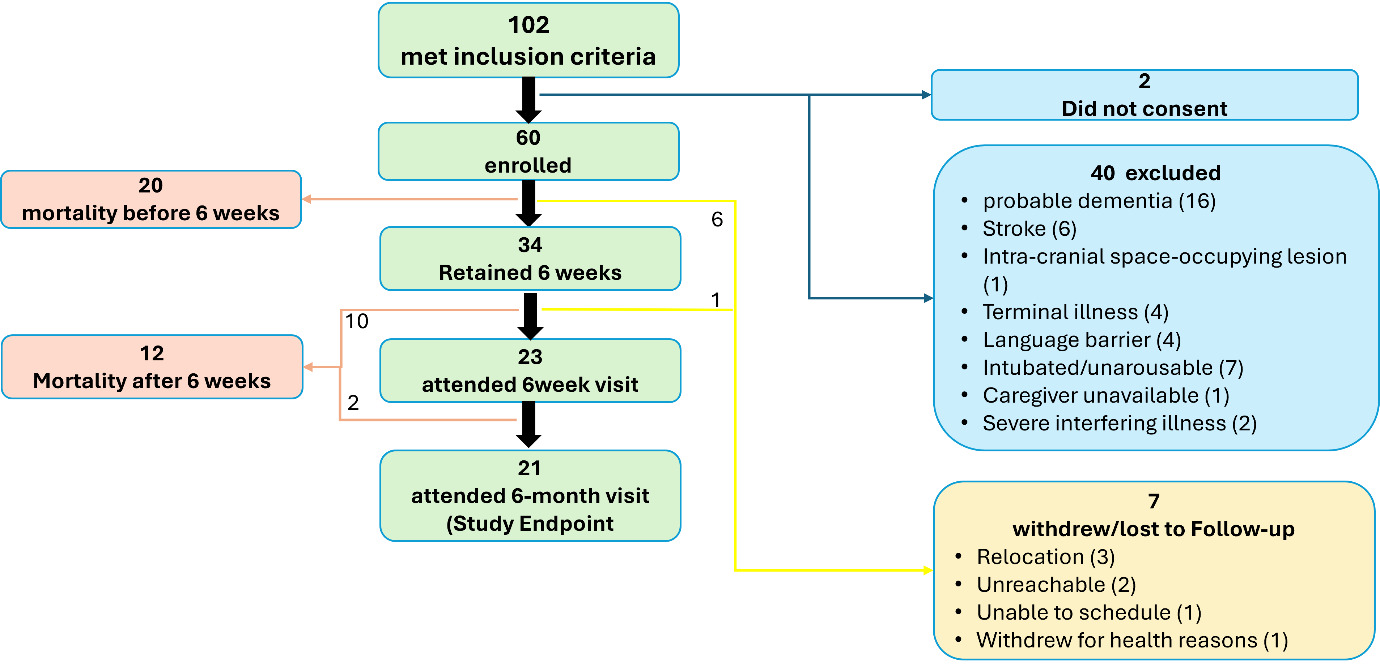
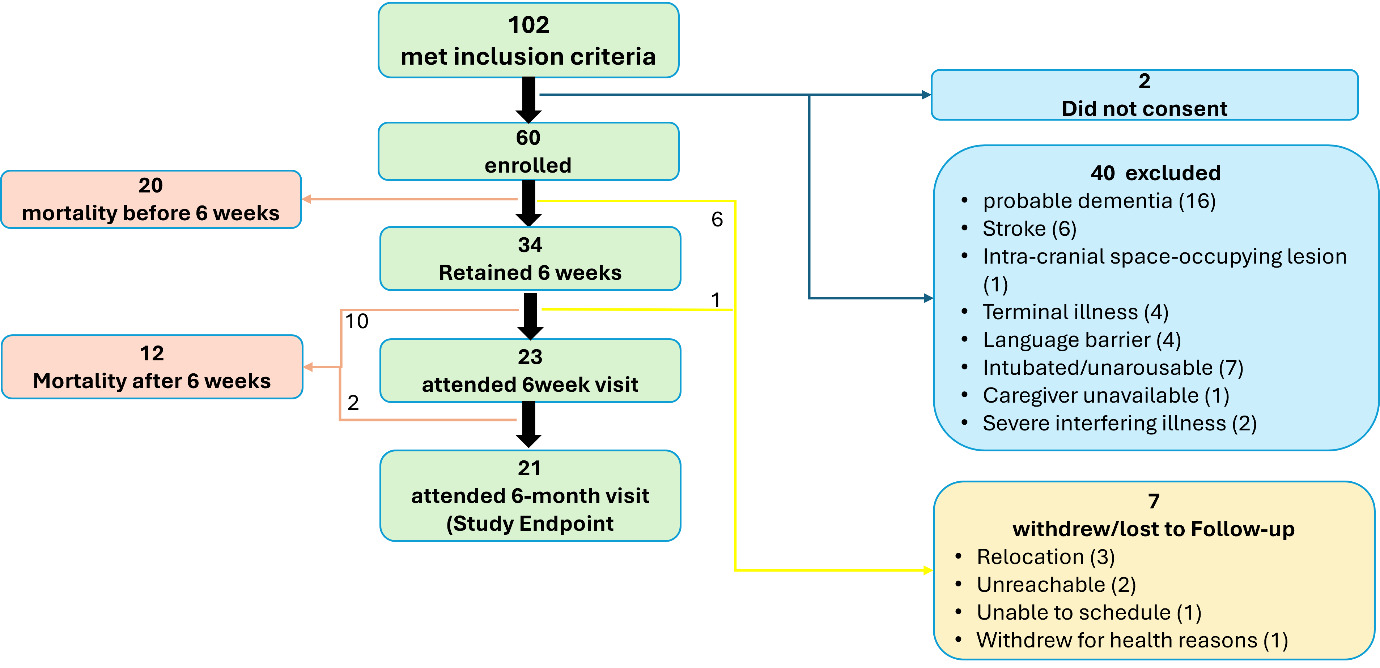
During the 5-month recruitment period from August 2024 to January 2025, 102 of the 1454 older adults admitted at KATH Accident and Emergency (A&E) met the inclusion criteria. Forty (40) had one or more exclusion criteria, two withheld consent (no reason given), and 60 were enrolled into the study. Figure 1 shows the study flowchart with reasons for exclusion.
3.1.1. Demographic Characteristics
The median age of the sample was 73.0 (IQR: 67.0-81.0) years, with 37 (61.7%) being female. Twenty-seven (45%) were married, while 58 (97%) lived with a partner, a relative or a friend. Thirty-one (51%) completed middle school, whereas 21 (35%) reported no formal education. Eight (13.3%) participants had IWI scores under the 50th centile, which correlates with the $2 poverty line.47
3.1.2. Medical History, Health Behaviours and Clinical Features
Twenty-three (38.3%) participants had two or more chronic disorders (multi-morbidity), with hypertension (27, 45.0%) and diabetes mellitus (11, 18.3%) being the most common. The most frequent reasons for admission were pneumonia (15, 25.0%), urinary tract infection (13, 21.7%), and heart disease (13, 21.7%). One-third (20) of the participants were assessed to be ‘living well with mild frailty’ or worse (CFS score of 4 or higher). Median baseline short IQCODE scores of 3.00 (IQR: 3.00-3.13) in the full baseline cohort, 3.00 (IQR: 3.00-3.00) in the NCI group and 3.00 (IQR: 3.00-3.13) in the non-NCI group showed no significant differences between groups. During admission, 14 (23.3%) participants received PIM according to the Beers Criteria, such as anticholinergics and hypnotics/sedatives.43
3.1.3. Delirium Features
The median CAM-S score (0-19) at enrolment was 8.5( IQR= 6.0-11.0). The median values of the peak and average CAM-S scores during admission were 9.0 (IQR: 6.0-12.0) and 7.3 (IQR: 5.0-9.3) respectively. Phenotypically, 40 (66.7%) had untyped (normoactive) delirium, while 11(18.3%) were hyperactive and 9 (15.0%) were hypoactive. CAM-S scores reduced by ≥1 among 11(18.3%) participants before discharge/hospital death. Table 1 summarises the characteristics of the study participants at enrolment.
3.1.4. Characteristics of Survivors at 6-Week Visit
Twenty-three survivors underwent cognitive and other assessments at the 6-week follow-up visit. Three (13.0%) had impaired cognition even though delirium had resolved, three (13.0%) were delirious, and 17 (74.0%) had normal cognition. All 23 (100%) were assessed to be ‘managing well’ (CFS score of 3) or worse. The supplementary table summarises the cohort’s characteristics at the 6-week visit.
3.2. Outcomes
3.2.1. New-onset Cognitive Impairment (NCI)
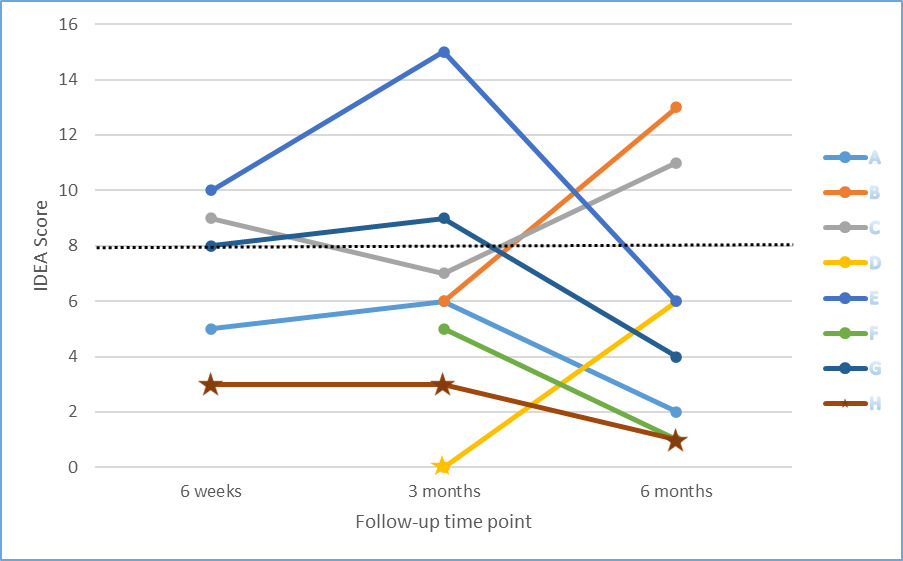
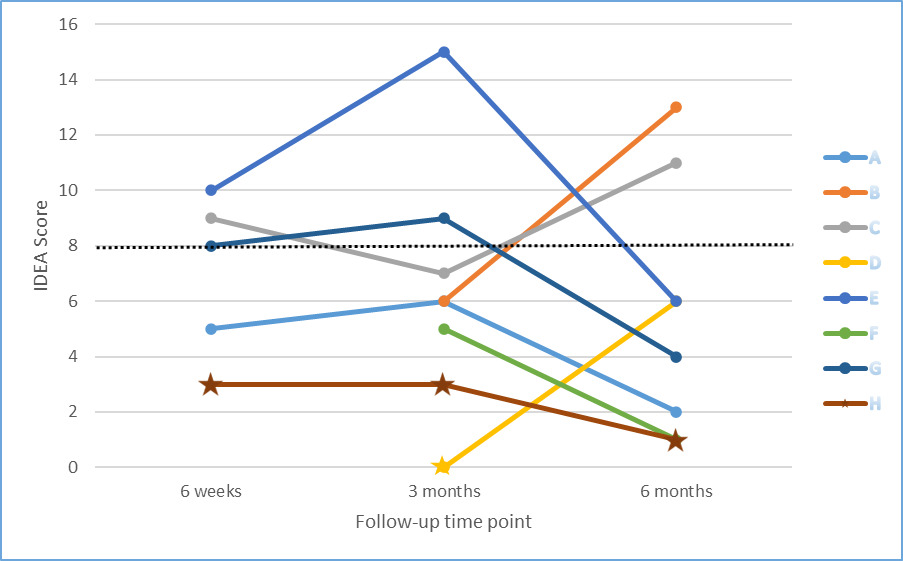
The incidence rate of NCI was 282 cases (95% CI: [117 - 676]) per 1000 person-years, with a cumulative incidence function of 0.22 (95% CI: [0.08 - 0.37]). One participant had persistent delirium at all three visits. Two participants showed delayed cognitive recovery; their scores improved from 6/15 and 7/15 at 3 months to 13/15 and 11/15 at 6 months, despite not having delirium at either time point. Figure 2 is a line graph showing the trends in IDEA scores for participants with impaired cognition during follow-up visits. The supplementary figure shows the trend of median IDEA scores for the full cohort and participants with and without NCI. Advanced age (≥80 years; P value: .001) was associated with cognitive impairment at 6 months. Table 2 shows the bivariate associations with NCI at 6 months.
3.2.2. Study Acceptability, Attrition and Mortality
Sixty (96.7%) of 62 potentially eligible patients and caregivers consented to participate in the study. None of the 60 enrolees withdrew from the study during hospitalisation. However, one (1.7%) participant withdrew at the 6-week time point due to worsening breathlessness.
Of the 60 enrolees, 53.3 % (32/60) died in total, with 25% (15/60) dying during admission and 33.3% (20/60) dying by 6 weeks post-discharge. The overall mortality rate was 1858 (95% CI: [1321 - 2614]) deaths per 1000 person-years with a cumulative incidence function of 0.42 (95% CI: [0.26 - 0.58]). Table 3 presents the results of the univariate Cox regression analysis of predictors of mortality with hazard ratios (HR) and 95% confidence intervals (CI). Delirium severity (CAM-S) at enrolment (HR:1.153; 95%CI: [1.020-1.303]), mean CAM-S score during hospitalization (HR:1.423; 95%CI: [1.020-1.303]), hyperactive delirium (HR: 2.632; 95%CI: [1.119-6.188]) and frailty (CFS) at 6 weeks (HR:1.817; 95%CI: [1.001-3.297]) were positively associated with mortality. On the other hand, the use of PIM for dementia and delirium (HR:0.214; 95%CI: [0.065-0.706]) was linked with a lower risk of mortality. Six (10%) participants were lost to follow-up: three relocated to different cities/countries, one was unable to schedule time for visits, and two were unreachable via phone.
4.0. DISCUSSION
This pilot study estimated the cumulative incidence of NCI at 22.4% 6-months after hospitalisation in a cohort of medically ill older Ghanaians with delirium. Study acceptability was 96.7% (60/62), with a high total attrition of 65.0% (39/60), due to a crude mortality of 53.3% (32/60) and 11.7% (7) loss to follow-up/withdrawal.
The significant 6-month cumulative incidence of NCI (22.4% 95%CI: [0.08-0.37]) observed in this cohort aligns with broader evidence suggesting that delirium is a marker of elevated risk for subsequent cognitive decline e.g., the earlier cited meta-analysis that reported 1.8 times greater odds of objective cognitive decline, and the large Scottish retrospective cohort study that observed a cumulative dementia incidence of 9% by 6 months post discharge among older adults hospitalized with delirium.19,20 A direct comparison of effect sizes is precluded by the methodological limitations of the present preliminary study, such as its small sample size, use of a screening tool, and the absence of a control group. However, the demonstration of measurable new-onset cognitive impairment 6 months after discharge in one in five hospital-associated delirium survivors highlights the need for and feasibility of longitudinal delirium research in African hospital settings. Nevertheless, it must be noted that the 6-month follow-up period in this study is too short to fully characterise post-delirium cognitive trajectories, which have been shown to continue to evolve over longer periods, with cognitive delayed recovery and decline observed beyond 6 months.48
The high mortality rate and the association between delirium severity and mortality observed in this present study concurs with other global and African findings, which identify delirium as an independent predictor of mortality in hospitalised older adults.12,19,49,50 Compared to our earlier study in this population, which reported 18% hospital mortality in a sample of 483 participants not excluding people with stroke and pre-existing dementia, 25% of this much smaller sample of 60 died during admission.12 Global studies confirm the association between delirium and mortality,19,51 which has been attributed to hospital-acquired conditions (e.g. falls and bedsores), other noxious insults (sleep disruption, malnutrition, dehydration, and aspiration pneumonia), and use of restraining devices, which occur more frequently in patients with delirium.52 Even though we observed no significant differences in baseline characteristics of survivors and participants who died (Table 1), the high mortality raises concern about survivor bias, as cognitive outcomes could only be observed in presumably healthier survivors, possibly resulting in a lower incidence estimate of post-delirium cognitive impairment.
The paradoxical negative association observed between mortality and the prescription of PIM for delirium or dementia (such as anticholinergics and sedative/hypnotics) more likely reflects the avoidance of these medications in participants who were more obviously and severely delirious than an independent protective effect of these medications against mortality. In this sample mortality was higher among participants who had higher CAM-S at enrolment (Hazard ratio= 1.1.15 95%CI[1.02-1.30]) higher mean CAM-S (Hazard ratio= 1.42 95%CI[1.261-1.605]) , hyperactive delirium (Hazard ratio= 2.63 95%CI[1.12-6.19]). We also observed that none of the 11 participants with hyperactive delirium (p=.053) received PIM during admission, and those with higher mean CAM-S (beta coefficient -0.29 95%CI[−0.551 - −0.044]) were less likely to. It is thus plausible that the avoidance of these medications in more obviously and severely delirious participants, who were also more likely to die is responsible for the observed inverse relationship between mortality and potentially deliriogenic medications.
To the best of our knowledge, this is the first African study to estimate the risk of new-onset cognitive impairment after delirium among hospitalised older adults. This study draws attention to the need to investigate the potential role of delirium in accelerating cognitive decline among hospitalized older Africans and provides preliminary evidence supporting the feasibility of and need for future studies investigating post-delirium cognitive trajectories in this region where the high burden of delirium likely contributes to the projected disproportionate increase in dementia prevalence in the coming decades.12–15,27
This pilot study has several limitations. The small sample size reduces estimate precision and the absence of a control group restricts causal inference. Its findings make a case for the need to include sub-Saharan African populations in studies of the relationship between delirium and later cognitive impairment (including dementia), but it must be noted that our main outcome was cognitive impairment, based on a single assessment with screening tool, which should not be taken for a formal dementia diagnosis.
Future research should comprise adequately powered, prospective cohorts with non-delirium comparison groups, longer follow-up, and more robust cognitive evaluation, including formal dementia diagnoses, to more definitively characterize post-delirium trajectories in sub-Saharan Africa. Analytical approaches such as competing-risk and joint survival–cognition models, inverse probability-of-censoring weights, and multi-state frameworks may be employed to address the high, severity-linked mortality and reduce survivor bias.
In conclusion, this study estimates a 22% incidence of new-onset cognitive impairment with a high competing mortality risk 6 months after hospitalisation with delirium in a cohort of previously cognitively normal older Ghanaians. Future methodologically robust prospective cohort studies of post-delirium cognitive trajectories and outcomes are necessary and feasible in sub-Saharan Africa.
ACKNOWLEDGEMENT
The authors would like to acknowledge Prof. Akin Ojagbemi for his critique and advice on this manuscript, and the staff and clients of Komfo Anokye Teaching Hospital for their support with and participation in this project.
AUTHOR CONTRIBUTIONS
J-PO: Conceptualisation, data curation, methodology, formal analysis, project administration, Writing- original draft, review & editing
CO-A: Investigation, writing- original draft
RD-A: Formal analysis, visualisation
GA: Investigation, writing- original draft
GO: Investigation, writing- original draft
GSA: Investigation, visualisation
SSA: Investigation, writing- original draft
RM: Writing-review & editing
CM: Writing-review & editing
LR: Supervision, methodology, writing-review
RO-A: Supervision, resources
FSS: Supervision, resources
CAM- Funding acquisition, methodology, Supervision
ME- Conceptualisation, methodology, resources, Supervision, project administration, Writing-review & editing
ETHICS STATEMENT
This study was conducted in accordance with the ethical standards set out in the 1964 Declaration of Helsinki and its subsequent amendments. Ethical approval was obtained from the KATH Institutional Review Board (KATH IRB/AP/091/24).
SOURCE OF FUNDING
Research reported in this publication was supported by the Fogarty International Centre of the National Institutes of Health under grant #D43TW009345 awarded to the Northern Pacific Global Health Fellows Program. The content of this article is solely the responsibility of the authors and does not necessarily represent the official views of the National Institutes of Health.
DECLARATION OF INTERESTS
ME is supported by the National Institute of Neurological Disorders and Stroke (K23NS131444) and the Andrea and Lawrence A. Wolfe Research Professorship. All other authors have no interests to declare.
DATA AVAILABILITY STATEMENT
The datasets generated during the current study are not publicly available due to ethical restrictions but are available from the corresponding author on reasonable request.
ABBREVIATIONS
IDEA: Identification and Intervention for Dementia in Elderly Africans Study Cognitive Test
KATH: Komfo Anokye Teaching Hospital.
MOTYB: Months of the Year Backwards
DOTYB: Days of the Year Backwards
NCI: New-onset Cognitive Impairment